FootballScoop's annual research project/public service is back. For the first time since 2019, all five major college football divisions -- FBS, FCS, Division II, Division III, NAIA -- played at the same time, which means we can compare excellence across divisions, across regions, across space and time.
The goal here is two fold. One, to spotlight excellence that might've been overshadowed during the season.
And two, by placing that excellence in context, we can point coaching staffs looking to improve their rushing offense, their pass rush, their red zone play-calling in the general direction of some answers.
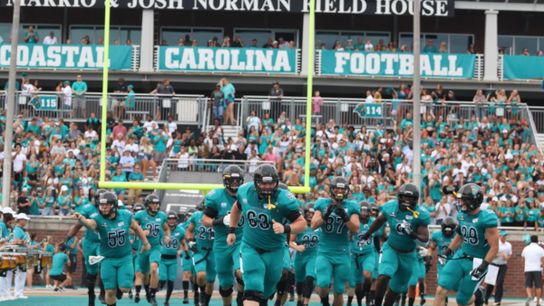
For instance, Coastal Carolina's offense led FBS in yards per pass, yards per rush, third down offense, red zone touchdowns, and all of college football in passing efficiency. Jackson State's defense led FCS in yards play, passing efficiency, sacks and tackles for loss per game. And Delaware Valley's defense... well, if you're looking to get better on defense, you might want to start your journey in Doylestown, Pa., and visit coordinator Nick Brady.
Without further ado, here are your 2021 Statistical Champions.
Scoring Offense
FBS: Ohio State -- 45.7 points per game
FCS: Southeastern Louisiana -- 45.1
D2: Ferris State (Mich.) -- 47.2
D3: Central (Iowa) -- 53.5
NAIA: Morningside (Iowa) -- 55.6
Yards Per Play
FBS: Ohio State -- 7.96
FCS: Southeastern Louisiana -- 7.07
D2: West Florida -- 7.75
D3: North Central (Ill.) -- 8.00
NAIA: N/A
Total Offense
FBS: Ohio State -- 561.2 yards per game
FCS: Eastern Washington -- 554.5
D2: Ferris State (Mich.) -- 511.5
D3: Central (Iowa) -- 570.1
NAIA: Morningside (Iowa) -- 608.4
Rushing Offense
FBS: Air Force -- 327.77 yards per game
FCS: Davidson -- 336.5
D2: Harding (Ark.) -- 390.1
D3: Merchant Marine (N.Y.) -- 390.3
NAIA: Bethel (Kan.) -- 409.5
Yards Per Carry
FBS: Coastal Carolina -- 5.84
FCS: North Dakota State -- 6.21
D2: Valdosta State (Ga.) -- 6.62
D3: Wheaton (Ill.) -- 6.85
NAIA: Bethel (Kan.) -- 7.24
Passing Offense
FBS: Western Kentucky -- 433.7 yards per game
FCS: Presbyterian -- 414.7
D2: Mary (N.D.) -- 356.6
D3: Central (Iowa) -- 394.5
NAIA: Morningside (Iowa) -- 386.4
Yards Per Attempt (min. 300 attempts)
FBS: Coastal Carolina -- 10.74
FCS: Southeastern Louisiana -- 9.29
D2: Northwest Missouri State -- 10.36
D3: North Central (Ill.) -- 10.99
NAIA: Morningside (Iowa) -- 10.21
Passing Efficiency (min. 300 attempts)
FBS: Coastal Carolina -- 192.02
FCS: Southeastern Louisiana -- 173.35
D2: Northwest Missouri State -- 179.14
D3: Mary Hardin-Baylor (Texas) -- 191.17
NAIA: N/A
Third Down Conversions
FBS: Coastal Carolina -- 53.9%
FCS: Davidson -- 53.0
D2: Harding (Ark.) -- 55.2
D3: Chicago -- 56.6
NAIA: Morningside (Iowa) -- 56.0
Red Zone Touchdowns
FBS: Coastal Carolina -- 81.25%
FCS: Youngstown State -- 80.0
D2: Nebraska-Kearney -- 87.2
D3: Belhaven (Miss.) -- 81.1
NAIA: Taylor (Ind.) -- 81.8
Scoring Defense
FBS: Georgia -- 10.2 points per game
FCS: North Dakota State -- 11.1
D2: Albany State (Ga.) -- 6.2
D3: Delaware Valley (Pa.) -- 6.8
NAIA: Lindsey Wilson (Ky.) -- 11.2
Yards Per Play
FBS: Wisconsin -- 4.10
FCS: Jackson State -- 3.88
D2: Albany State (Ga.) -- 3.42
D3: Delaware Valley (Pa.) -- 2.43
NAIA: N/A
Total Defense
FBS: Wisconsin -- 235.3 yards per game
FCS: Holy Cross -- 254.5
D2: Albany State (Ga.) -- 199.2
D3: Delaware Valley (Pa.) -- 126.8
NAIA: Peru State (Neb.) -- 211.3
Rushing Defense
FBS: Wisconsin -- 61.0 yards per game
FCS: Harvard -- 64.6
D2: Augustana (S.D.) -- 41.8
D3: Delaware Valley (Pa.) -- 30.1
NAIA: Peru State (Neb.) -- 57.0
Yards Per Carry Allowed
FBS: Wisconsin -- 1.99
FCS: Harvard -- 2.01
D2: Augustana (S.D.) -- 1.57
D3: Delaware Valley (Pa.) -- 1.12
NAIA: N/A
Passing Defense
FBS: Washington -- 142.9 yards per game
FCS: Sacred Heart -- 118.4
D2: Fayetteville State (N.C.) -- 112.6
D3: Delaware Valley (Pa.) -- 96.7
NAIA: Kentucky Christian -- 144.3
Yards Per Attempt Allowed (min. 300 attempts)
FBS: Washington -- 5.41
FCS: Jackson State -- 5.09
D2: Charleston (W.Va.) -- 4.69
D3: Delaware Valley (Pa.) -- 3.80
NAIA: N/A
Passing Efficiency
FBS: Cincinnati -- 103.37
FCS: Jackson State -- 95.94
D2: Charleston (W.Va.) -- 87.92
D3: Delaware Valley (Pa.) -- 70.44
NAIA: N/A
Sacks Per Game
FBS: Oklahoma State -- 4.00
FCS: Jackson State -- 4.23
D2: Western Colorado -- 3.92
D3: Wheaton (Ill.) -- 4.33
NAIA: Georgetown College (Ky.) -- 4.40
Tackles For Loss Per Game
FBS: Oklahoma State -- 8.4
FCS: Jackson State -- 8.8
D2: Bowie State (Md.) -- 9.8
D3: Brevard College (N.C.)/Illinois College -- 9.2
NAIA: N/A
Third Down Defense
FBS: Houston -- 25.67%
FCS: Yale -- 22.1
D2: Albany State (Ga.) -- 25.1
D3: Delaware Valley (Pa.) -- 20.1
NAIA: N/A
Red Zone Touchdowns Allowed
FBS: Georgia -- 28.13%
FCS: Dartmouth -- 44.0
D2: Seton Hill (Pa.) -- 44.1
D3: Delaware Valley (Pa.) -- 18.8
NAIA: N/A
Turnover Margin
FBS: Nevada -- 1.23 per game
FCS: James Madison -- 1.36
D2: Barton College (N.C.) -- 1.55
D3: Alma College (Mich.) -- 2.20
NAIA: N/A
Penalties Per Game
FBS: ULM -- 3.67
FCS: Furman -- 3.64
D2: Harding (Ark.) -- 3.08
D3: Plymouth State (N.H.) -- 2.60
NAIA: Evangel (Mo.) -- 2.91
