The spring is a time of renewal. Birds are chirping, flowers are blooming and coaches are in the film room, studying ways to improve their teams for the fall.
To help with that effort, FootballScoop has tracked 26 separate statistical categories and delivered you the champion in each of them. Want to know who had the best rush defense of all the 753 schools in the NCAA and NAIA? It's here. (Spoiler alert: You're going to want to give St. Thomas defensive coordinator Wallie Kuchinski a call if you want to play better defense in 2018.)
Need to improve your red zone offense? Call West Virginia State head coach John Pennington. His Yellow Jackets scored on 47 of 48 tries in 2017. Want to improve your third down defense? Rich Wright at Northwest Missouri State might have some ideas. The Bearcats were the only team in college football to hold opponents under 20 percent on third downs.
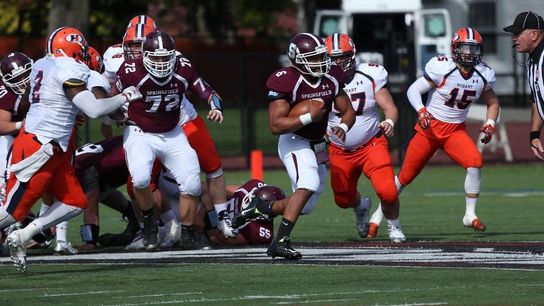
Want to run the ball better? You might consider visiting offensive coordinator Greg Webster at Springfield, Mass., where Springfield College out-rushed 752 other schools both on a per game basis (435.2 yards per game) and a per rush basis (7.04).
How about the most important stat in football: turnover margin. Charlie Hall went 12-1 in his first season at Southern Oregon thanks to a national-best 1.90 turnover advantage per game.
Behold, the statistical scoreboard across all of college football:
Scoring Offense
FBS: UCF -- 48.2 points per game
FCS: Sam Houston State -- 43.3
D2: Bowie State (Md.) -- 54.5
D3: Mount Union (Ohio) -- 50.5
NAIA: Southeastern (Fla.) -- 55.1
Total Offense
FBS: Oklahoma -- 579.6 yards per game
FCS: Sam Houston State -- 538.1
D2: Bowie State (Md.) -- 566.3
D3: Franklin (Ind.) -- 564.5
NAIA: Morningside (Iowa) -- 575.6
Yards Per Play
FBS: Oklahoma -- 8.29
FCS: Alcorn State -- 7.04
D2: Bowie State (Md.) -- 7.372
D3: Franklin (Ind.) -- 7.69
NAIA: Marian (Ind.) -- 7.81
Rushing Offense
FBS: Army -- 362.3 yards per game
FCS: Kennesaw State -- 330.2
D2: Eastern New Mexico -- 352.7
D3: Springfield College (Mass.) -- 435.2
NAIA: Reinhardt (Ga.) -- 342.2
Yards Per Carry
FBS: Arizona -- 6.56
FCS: Alcorn State -- 6.42
D2: Gannon (Pa.) -- 6.61
D3: Springfield College (Mass.) -- 7.04
NAIA: Marian (Ind.) -- 6.81
Passing Offense
FBS: Oklahoma State -- 389.2 yards per game
FCS: Sam Houston State -- 362.7
D2: Adams State (Colo.) -- 353.0
D3: Franklin (Ind.) -- 407.1
NAIA: Campbellsville (Ky.) -- 382.9
Yards Per Attempt
FBS: Oklahoma -- 11.70
FCS: Furman -- 10.33
D2: Ohio Dominican -- 10.35
D3: Trine (Ind.) -- 11.56
NAIA: Peru State (Neb.) -- 9.59
Passing Efficiency
FBS: Oklahoma -- 202.66
FCS: Central Arkansas -- 177.01
D2: Ohio Dominican -- 190.91
D3: Mount Union (Ohio) -- 217.45
NAIA: Morningside (Iowa) -- 183.84
First Downs
FBS: Oklahoma State -- 27.6 per game
FCS: South Dakota -- 27.4
D2: Bowie State (Md.) -- 29.6
D3: Lakeland (Wis.) -- 28.0
NAIA: Southeastern (Fla.) -- 32.1
Third Down Conversions
FBS: Army -- 55.15 percent
FCS: Princeton -- 51.56
D2: LIU-Post (N.Y.) -- 58.09
D3: Merchant Marine (N.Y.) -- 53.85
NAIA: Morningside (Iowa) -- 58.16
Red Zone Offense
FBS: Florida International -- 97.56 percent
FCS: Northern Iowa -- 92.16
D2: West Virginia State -- 97.92
D3: Denison (Ohio) -- 95.00
NAIA: Not provided
Scoring Defense
FBS: Alabama -- 11.9 points per game
FCS: James Madison -- 11.1
D2: Northwest Missouri State -- 9.3
D3: Mary Hardin-Baylor (Texas) -- 7.3
NAIA: Reinhardt (Ga.) -- 14.6
Total Defense
FBS: Alabama -- 260.4 yards per game
FCS: North Dakota State -- 237.4
D2: Northwest Missouri State -- 212.8
D3: St. Thomas (Minn.) -- 157.6
NAIA: Reinhardt (Ga.) -- 235.6
Yards Per Play Allowed
FBS: Alabama -- 3.99
FCS: Jacksonville State -- 3.84
D2: Northwest Missouri State -- 3.49
D3: St. Thomas (Minn.) -- 2.79
NAIA: Reinhardt (Ga.) -- 3.83
Rushing Defense
FBS: Alabama -- 94.7 yards per game
FCS: McNeese State -- 54.5
D2: Central Washington -- 44.6
D3: St. Thomas (Minn.) -- 21.9
NAIA: Reinhardt (Ga.) -- 70.8
Yards Per Carry Allowed
FBS: Alabama -- 2.72
FCS: McNeese State -- 1.94
D2: Central Washington -- 1.60
D3: St. Thomas (Minn.) -- 0.73
NAIA: Benedictine (Kan.) -- 2.09
Passing Defense
FBS: Michigan -- 150.1 yards per game
FCS: Youngstown State -- 143.7
D2: Grand Valley State (Mich.) -- 127.5
D3: Monmouth (Ill.) -- 112.4
NAIA: Bluefield (Va.) -- 141.4
Yards Per Attempt Allowed
FBS: Alabama -- 5.45
FCS: St. Francis (Pa.) -- 5.26
D2: Bowie State (Md.) -- 4.86
D3: MIT -- 4.70
NAIA: Langston (Okla.) -- 4.98
Pass Efficiency Defense
FBS: Wisconsin -- 96.39
FCS: James Madison -- 83.12
D2: Bowie State (Md.) -- 87.41
D3: MIT -- 79.96
NAIA: Langston (Okla.) -- 95.17
First Downs Allowed
FBS: Mississippi State -- 13.5
FCS: North Dakota State -- 12.7
D2: Northwest Missouri State -- 12.7
D3: St. Thomas (Minn.) -- 8.5
NAIA: William Penn (Iowa) -- 14.1
Third Down Defense
FBS: Michigan -- 26.11 percent
FCS: McNeese State -- 23.84
D2: Northwest Missouri State -- 19.88
D3: St. Thomas (Minn.) -- 20.30
NAIA: Reinhardt (Ga.) -- 25.00
Red Zone Defense
FBS: Troy -- 61.36 percent
FCS: UT Martin -- 60.60
D2: Shippensburg (Pa.) -- 55.56
D3: Mary Hardin-Baylor (Texas) -- 36.00
NAIA: Not provided
Sacks
FBS: Miami -- 3.39 per game
FCS: Sacramento State -- 3.91
D2: Central Washington -- 5.08
D3: Brockport (N.Y.) -- 4.50
NAIA: Southern Oregon -- 4.73
Tackles For Loss
FBS: Michigan/Northern Illinois -- 8.77 per game
FCS: Montana -- 9.36
D2: Morehouse (Ga.) -- 11.30
D3: St. Thomas (Minn.) -- 11.15
NAIA: Not provided
Penalties
FBS: Minnesota -- 3.25
FCS: Furman -- 3.15
D2: Bentley (Mass.) -- 3.30
D3: Randolph-Macon (Va.) -- 2.50
NAIA: St. Francis (Ill.) -- 4.10
Turnover Margin
FBS: Wyoming -- 1.85 per game
FCS: Kennesaw State -- 1.64
D2: Assumption (Mass.) -- 1.77
D3: Carthage (Wis.) -- 1.60
NAIA: Southern Oregon -- 1.90
